Study 1 (N=174) was a randomized, double-blind, placebo-controlled, dose-response study consisting of an 8-week baseline period followed by an 18-week treatment period. Patients were randomized to receive placebo or 1, 3, or 6g/day vigabatrin administered twice daily. During the first 6 weeks following randomization, the dose was titrated upward beginning with 1g/day and increasing by 0.5g/day on days 1 and 5 of each subsequent week in the 3g/day and 6g/day groups, until the assigned dose was reached.
Results for the primary measure of effectiveness, reduction in monthly frequency of complex partial seizures, are shown in Table 8. The 3g/day and 6g/day dose groups were statistically significantly superior to placebo, but the 6 g/day dose was not superior to the 3g/day dose.

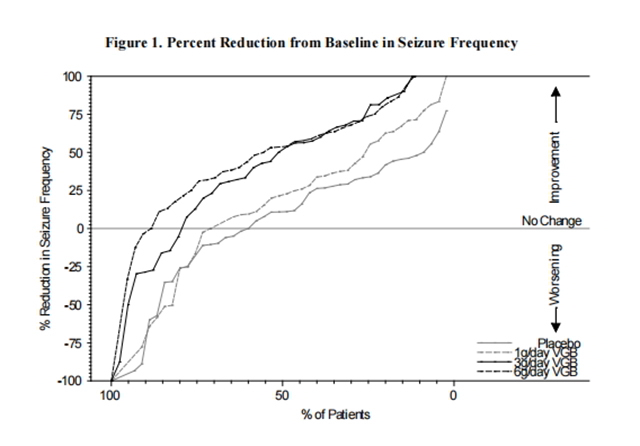
Figure 1 presents the percentage of patients (X-axis) with a percent reduction in seizure frequency (responder rate) from baseline to the maintenance phase at least as great as that represented on the Y-axis. A positive value on the Y-axis indicates an improvement from baseline (i.e., a decrease in complex partial seizure frequency), while a negative value indicates a worsening from baseline (i.e., an increase in complex partial seizure frequency). Thus, in a display of this type, a curve for an effective treatment is shifted to the left of the curve for placebo. The proportion of patients achieving any particular level of reduction in complex partial seizure frequency was consistently higher for the Vigabatrin 3 and 6g/day groups compared to the placebo group. For example, 51% of patients randomized to Vigabatrin 3 g/day and 53% of patients randomized to Vigabatrin 6g/day experienced a 50% or greater reduction in seizure frequency, compared to 9% of atients randomized to placebo. Patients with an increase in seizure frequency >100% are represented on the Y-axis as equal to or greater than -100%.

from FDA,2021.10